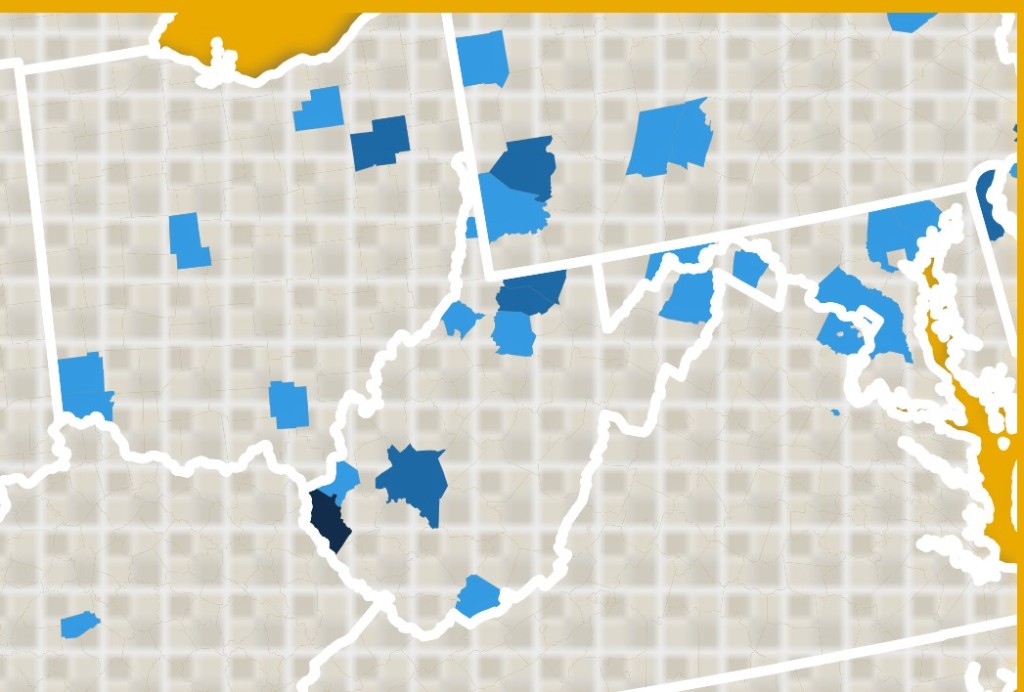
Where is the 2021 WVU football team from? This map shows where each player’s hometown is. Nice to see the WV, OH, PA, MD cluster. Also interesting to see the small cluster in the south-east, where Neal Brown and staff has strong ties.

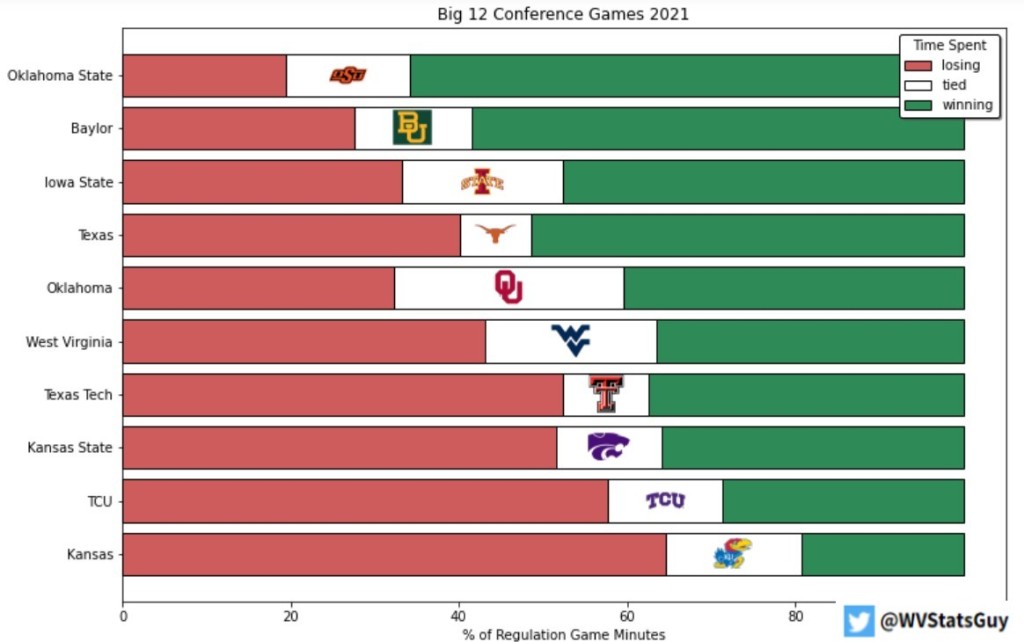
Time Spent During Conference Games: This was a really fun visual to make. It shows the amount of game time that each team spent winning, losing, and tied. Texas catches the eye as leading the third most time but finished league play at 3-6. I decided to sort the graph by the midpoint of the “tied” bar, because I wanted the logos to cascade. Some people on Twitter and Reddit didn’t prefer my sorting method, but I think it was the most visually pleasing compared to sorting by the “winning” or “losing” bars. I created this visual using drive-level data from the ESPN API on collegefootballdata.com. I used Python (and the dreaded matplotlib) to calculate all the values and do the plotting.
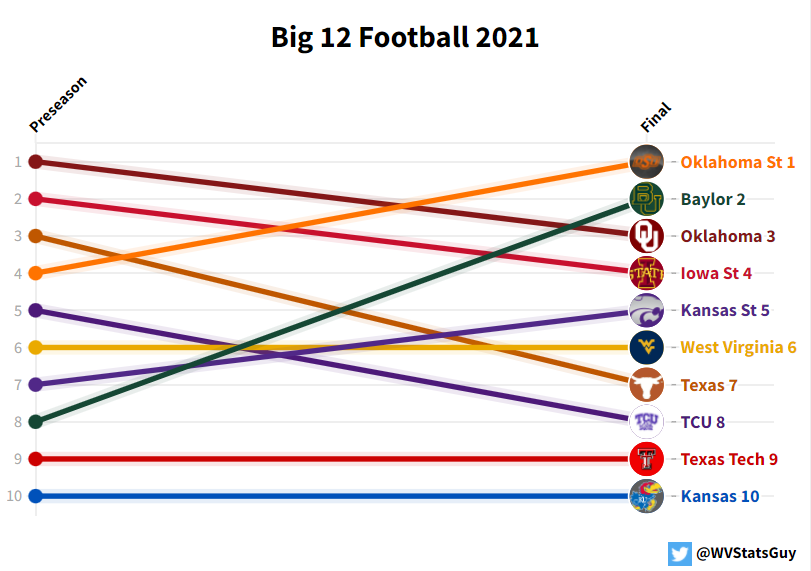
Big 12 Expectations vs Reality: Baylor was definitely the surprise of the conference, jumping from 8th in the preseason poll to ultimately wining the conference (this visual is just showing regular season standings). Texas was the biggest disappointment. WVU finished right where they were expected to.
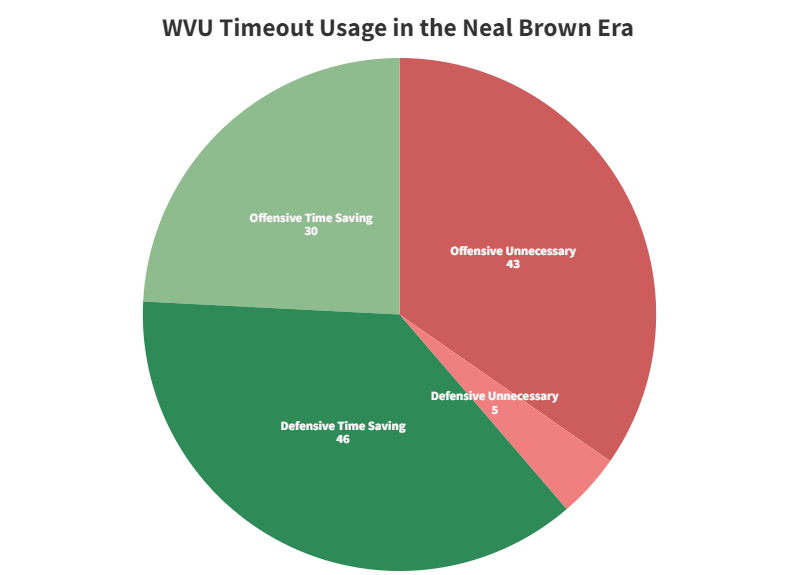
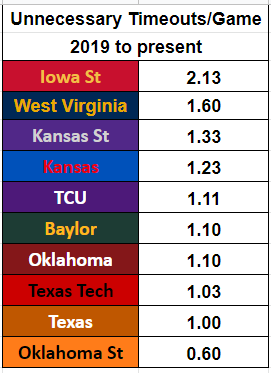
Unncecessary Timeout Usage: I looked into how WVU has used its timeouts in the Neal Brown era. I decided that a timeout in the final 4 minutes of a half is for “time-saving” and any other timeout is “unnecessary”. West Virginia is the second-worst in the league since 2019 at spending unnecessary TOs.
Originally tweeted by Joel (@WVStatsGuy) on November 15, 2021.
WVU All-Time Passing Yard Bar Chart Race: Interesting to see the evolution of the passing game over the years (though Marc Bulger did incredible for his era). This visualization scored a retweet from Geno Smith on Twitter. If Jarret Doege plays 12 games in the 2021 season and averages the same yards per game as last year, he will pass Pat White for 5th all-time (only counting Doege’s WVU yards). You can find the data here.
Monte Carlo Simulations for the NCAA tournament: A fun exercise to calculate probabilities of each teams’ tournament run. Below is the example I tweeted on Day 1 of the tournament. Code and explanation of the project can be found on here.
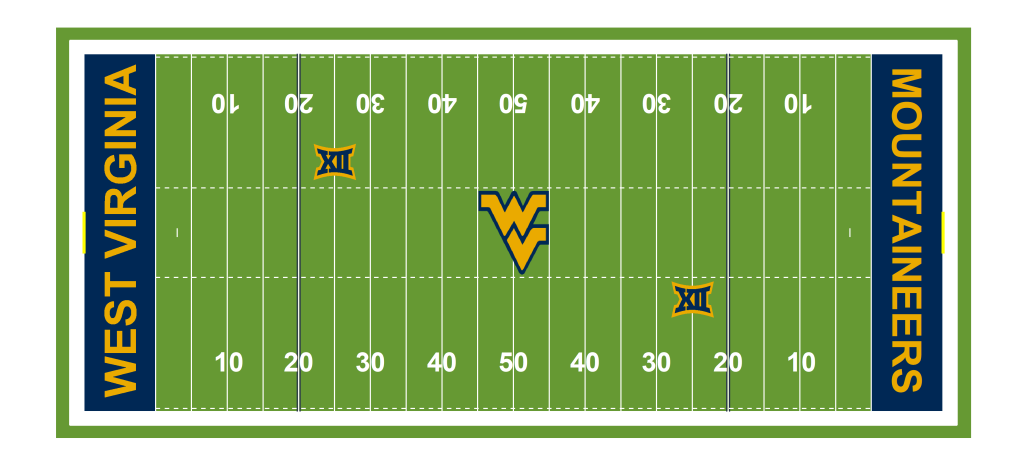
WVU Football Field Created in ggplot: Shoutout to @TheCoachEdwards for the field code. Code for this can be found on my GitHub.
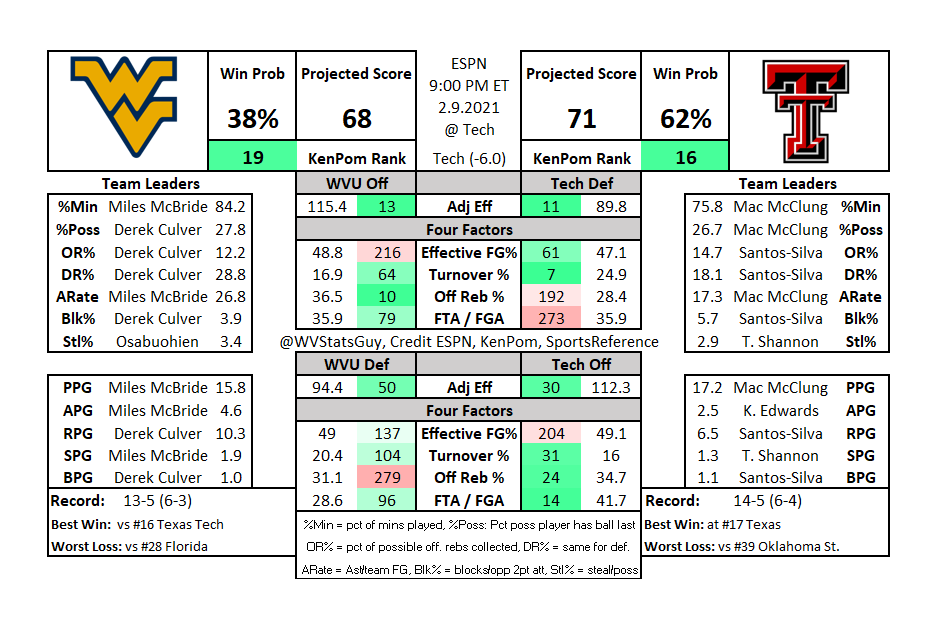
Example of WVU Preview: I post these on gameday on Twitter. I try to incorporate both common and more advanced player stats. Four Factors are a great way to get a snapshot of what a team does well (and are incredibly useful in predicting a winner). I use a script to create these and add a few manual adjustments.
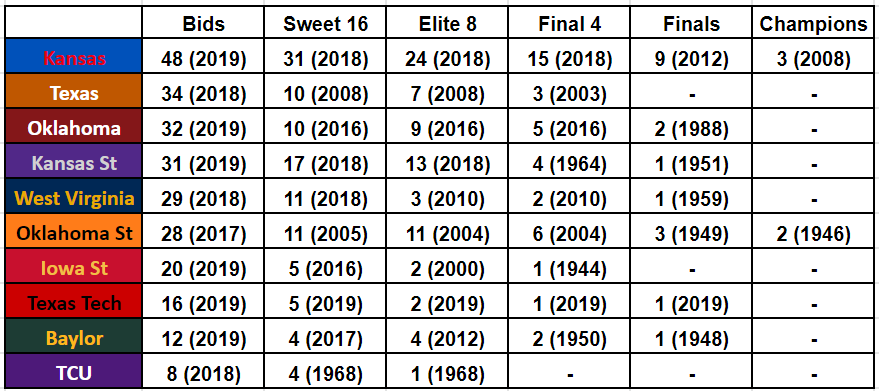
Big 12 Teams in the NCAA Tourney: Count of appearances, parenthesis indicates most recent appearance. Accurate as of end 2020 (reminder: no tourney in 2020). Excluding TCU, every team has made at least the Elite Eight in the last 20 seasons and at least one Final Four all-time.
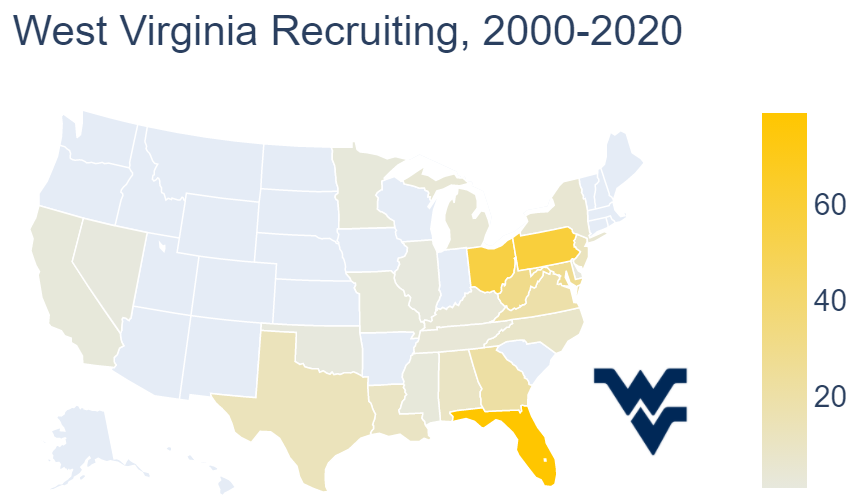
Where do WVU football recruits come from? In addition, WVU has had recruits from Canada, Sweden, UK, Finland, and Australia to my knowledge.
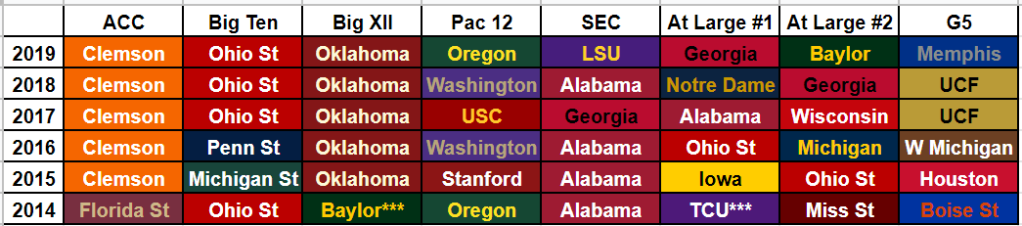
Eight Team Playoff: If the eight team playoff idea was adopted where bids were given to P5 champs, two at-large bids, and the highest-ranked G5 team. Ohio State is the only team who would have made every playoff.
College Football Wins for Current FBS Schools: A visualization I created a few years ago. Michigan has a nearly wire-to-wire lead, though several of their early opponents were questionable at best. Rutgers squandered the 9-1 lead.
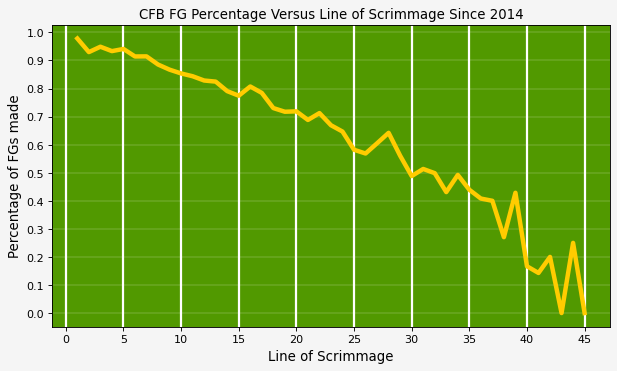
CFB FG Percentage Vs Line of Scrimmage: Data 2014-2020 seasons. Your team probably isn’t going for it on fourth down enough.
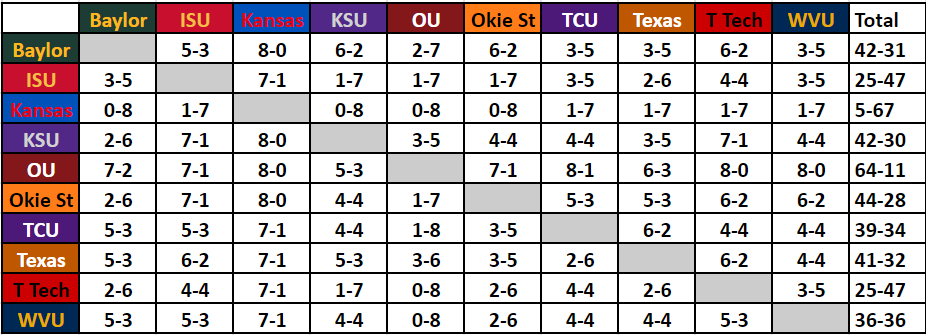
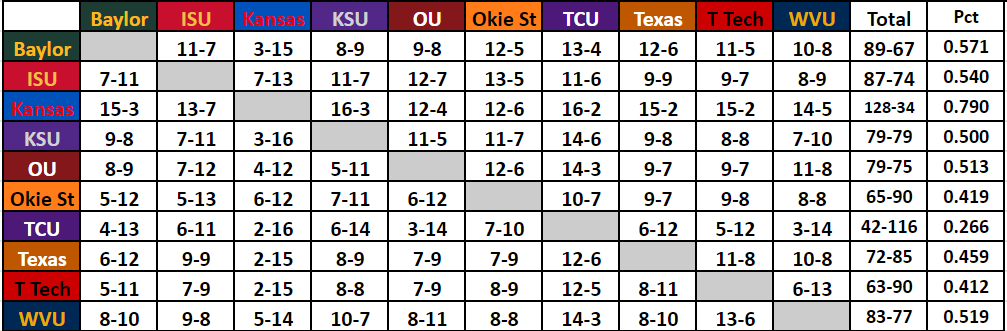
Big 12 Football H2H Records Since Realignment: Accurate as of end of 2019 season. Poor Kansas.
Big 12 Basketball H2H Records Since Realignment: Accurate as of end of 2019-20 season. Kansas clearly flexing that they’re a basketball school.
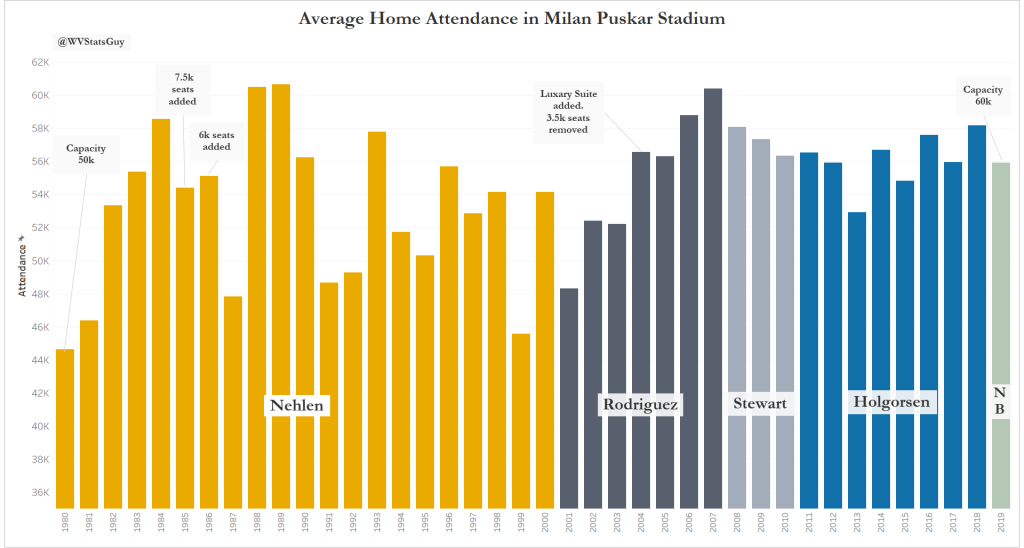
WVU Home Attendance: Interesting look at fluctuations in home attendance. Note: Axis does not start at zero. Who knows what the future holds…2020 attendance was sub 15,000 for all games.
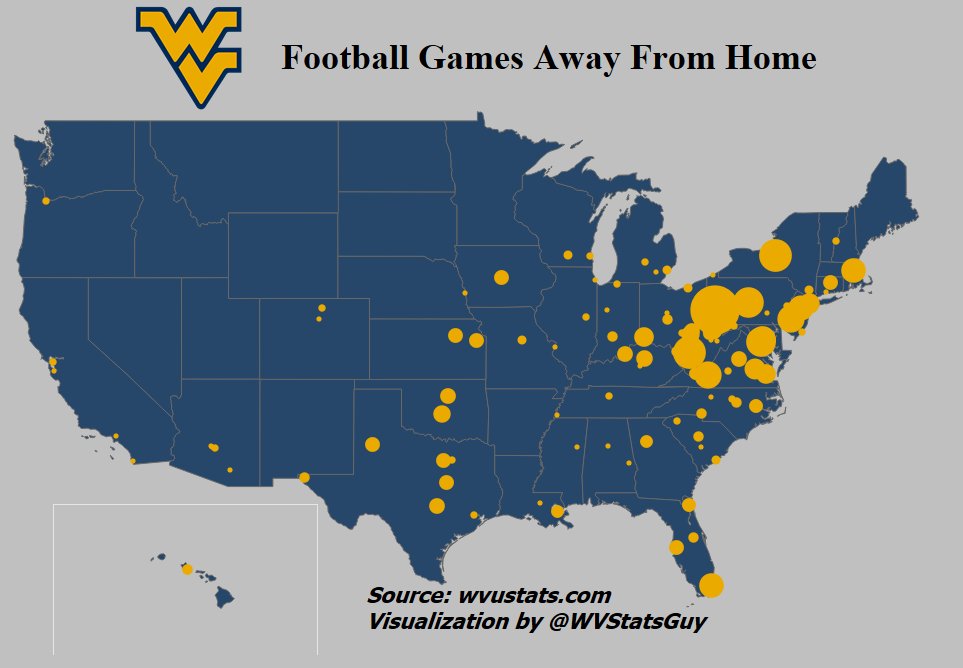
Locations of All WVU Football Games: Heavy concentration of games in the WV, VA, and PA regions. Lots of weird locations in the early years (Elkins, Buckhannon, Bluefield, etc). Thirty-five states represented.
Follow me on Twitter @WVStatsGuy
